
Offshore Wind Can Help Address PJM’s Growing Energy Challenge
Offshore wind remains a largely untapped resource that could play a major role in keeping the PJM grid both reliable and affordable.
PJM’s current energy mix includes natural gas, nuclear, coal, renewables, hydropower, and storage. Keeping up with projected demand growth will require significant investment across generation, transmission, storage, and tools to help manage demand. No single energy source can solve the challenge alone.
Utility-scale offshore wind, as part of a balanced energy portfolio, will help sustain the long-term economic growth and stability of one of the most critical power systems in the U.S.
Demand growth is outpacing new supply
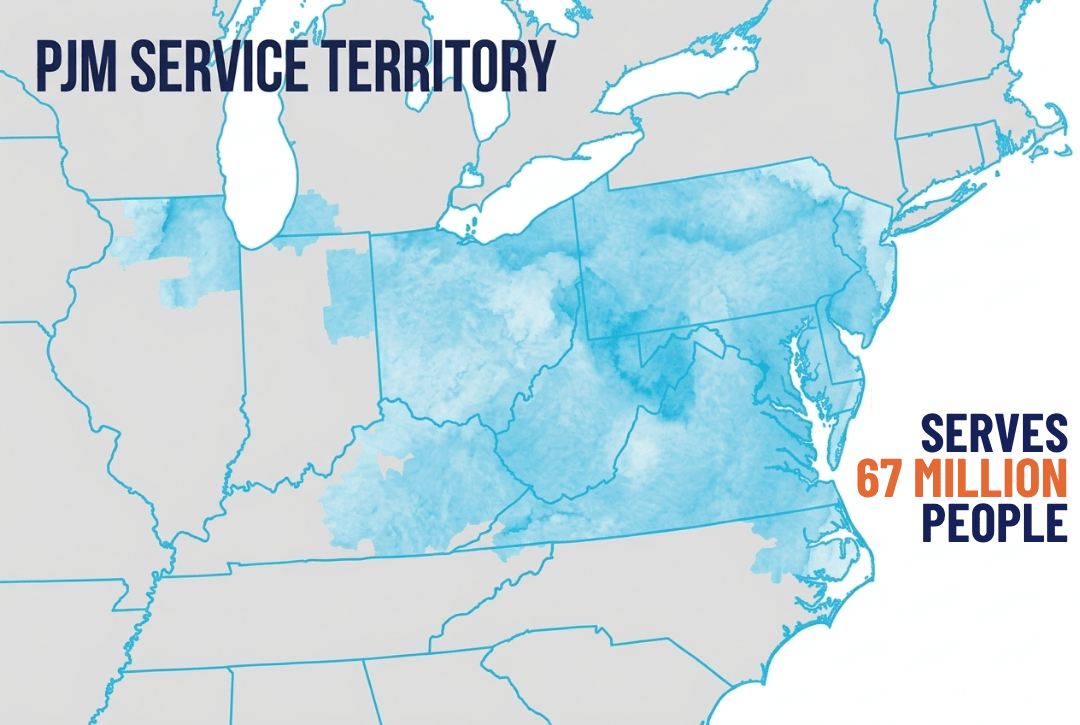
PJM serves 67 million customers across 13 states and Washington D.C., operating the largest power grid in North America. Electricity demand is rising faster than it has in decades, driven by data centers, advanced manufacturing, electrification, and heavy industry. New power supply is being added more slowly, even as demand growth accelerates. As the gap between supply and demand widens, concerns about reliability and affordability are intensifying.
Meeting this challenge will require expanding all domestic energy sources, including offshore wind.
The industries driving PJM’s load growth carry significant economic and strategic weight. Capacity shortfalls don’t just raise electricity prices and increase outage risk. They could slow or block the investments these sectors represent, with ripple effects for jobs, national security, and domestic supply chains.

PJM is projected to fall well short of its reliability target by 2033
Virginia is facing the worst of it. The state’s grid is under more strain than almost anywhere else in the country, driven by a massive concentration of data centers in Northern Virginia. At the same time, new power plants aren’t being built fast enough to keep up. PJM tried raising the price it pays to power suppliers to attract more capacity. Even at twice the normal ceiling, the market still came up 6 GW short. More money didn’t fix it because the power simply isn’t there yet.
Offshore wind is built for exactly when PJM needs it most
Offshore wind’s generation profile aligns directly with PJM’s emerging risk. Mid-Atlantic wind is strongest during winter months and evening hours, precisely when the grid is now most stressed and when solar and battery storage contribute least.
- Tripling current offshore wind capacity could cut outage risk by 46% in the Dominion zone, where rapid load growth and transmission constraints create acute reliability pressures.
- Offshore wind generates most strongly during winter nights, exactly when grid stress peaks and when solar and battery storage contribute least.
- Removing offshore wind from the portfolio would raise inland outage risk by 32% in states like Ohio, West Virginia, and Kentucky, states that never see a turbine but still feel the benefit when it’s there.
Research by Charles River Associates, released through Turn Forward’s Energy Research Exchange. Modeling uses PJM’s capacity market construct and CRA’s AdequacyX loss-of-load simulation tool. Base case assumes CVOW operational plus 2 GW of Maryland development by 2033. The 46% load-shedding reduction applies to the Dominion zone under a tripling of current offshore wind deployment. Full methodology in the report appendix. Customer count per PJM At a Glance fact sheet, April 2025.